chw42
Members
-
Joined
-
Last visited
Everything posted by chw42
-
At this point, he's not just sore anymore. It's an injury.
-
Add it in the included stats. It's one of the buttons on the bottom of the search.
-
Statcast search.
-
His exit velocity with RISP and 2 outs is far below his exit velocity with nobody on. His EV with nobody on is in the top 90 percentile while his EV with RISP and 2 outs is probably bottom 10 percentile. His expected batting average with RISP and 2 outs is better than his actual average of .043 at .137, but it's still pretty bad. He's just not making a lot of hard contact in those situations. I understand the sample size isn't huge, like southsider2k5 mentioned, but it's gotten to the point where people are noticing.
-
-
-
-
-
-
-
-
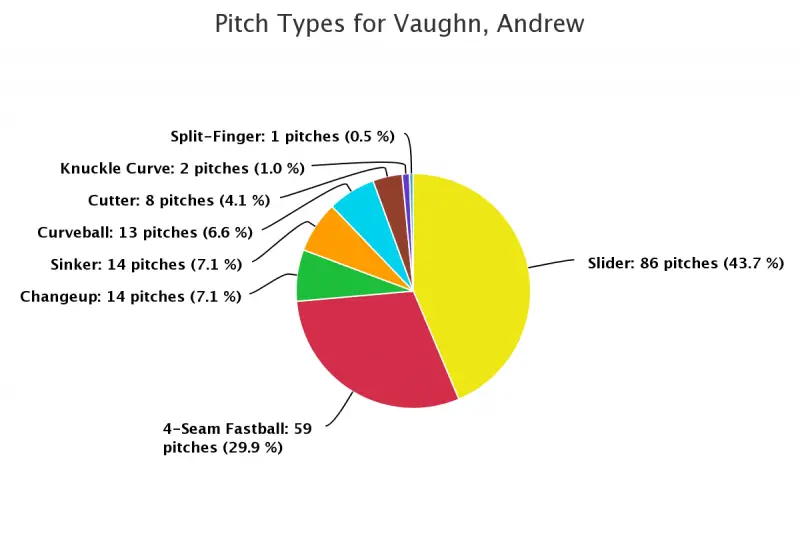
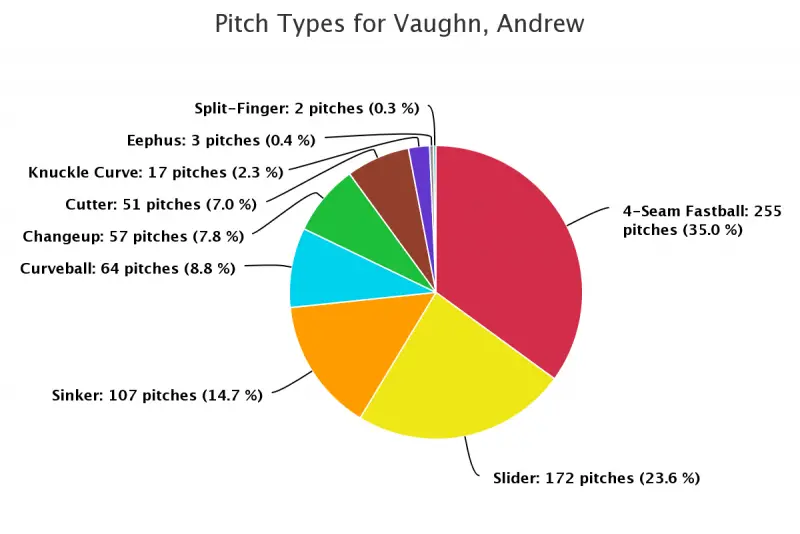
This is continuing on some of the discussion that was going on in the game thread. Vaughn has hit an atrocious .043 with runners in scoring position and less than 2 outs and we're obviously wondering...how? How does a guy who looks so good the rest of the time be so horrible when it really matters? With RISP and 2 outs, Vaughn is striking out 28.6% of the time and walks only 4.1% of the time. This is in comparison to a 20.6% K rate and 10.6% walk rate with no runners on. It's like he's a completely different hitter up there. But wait, that's not all. Below are the pitch profiles he faces in these 2 scenarios. The first one is with RISP and 2 outs and second is with nobody on. Notice how the pie looks pretty different? That's because with no runners on, Vaughn sees some type of fastball almost 60% of the time. He only sees a slider on 23.6%. With RISP and 2 outs, he sees a slider 43.7% of the time. That's a huge difference in pitch profile. Vaughn's numbers on sliders: .136 AVG with a 35.4% K rate. Vaughn's numbers on fastballs: .344 with a 12.8% K rate. Most likely explanation: when the going gets tough, teams follow the scouting report a bit more and possibly throw pitchers who have better sliders against Vaughn. Who, despite his improvement this year vs. righties and sliders, still struggles mightily against them.
-
-
-
-
-
-
-
-
-
-
-
-
-