Leaderboard
-
Y2Jimmy0
FutureSox Writer17Points11,921Posts -
Chicago White Sox
Members15Points41,731Posts -
thxfrthmmrs
Members13Points4,339Posts -

southsider2k5
Admin10Points187,693Posts




Popular Content
Showing content with the highest reputation on 12/24/2020 in all areas
-
8 points
-
7 pointsWe have been around quite a few blocks here at Soxtalk, and none of them are quite like the one we have just made. I know 2020 has been a year of loss and struggle for way to much of this country, and our little corner of the interwebs isn't immune from that. I just want to take the time to wish everyone a happy holiday season and a Merry Christmas. Hopefully even if those struggles are still present for you, this time can give even a temporary respite from the pressures of life.7 points
-
6 pointsWhy are so many people so willing to trade Madrigal. Who the hell will play 2B if he's traded?6 points
-
4 pointsLol Musgrove is a lot better than a #5 replacement level starting pitcher.4 points
-
4 points
-
3 points
-
3 points
-
3 pointsTake whatever value a 65-70 FV prospect produces. It would be a lot higher than whatever BTV is projecting. Or even if you just use Steamer, it's 3.3 WAR for 2021, conservatively project the same number for next 4 years (pretend there won't be any progression for a player entering his prime) multiple by $9M/WAR, it would be a lot higher than what his AFV is on BTV.3 points
-
3 pointsTerrible take. You don't average WAR for a player who spent majority of some of those years in the minors. If that's how BTV projects Moncada's value for the next 5 years, then they need to go back to the drawing board.3 points
-
Agreed. He's not serious about winning though. He never has been.3 points
-
3 points3.3 wins per season x 4 years of control = 13.2 projected wins over the life of control. 13.2 x $9.0M cost per win assumption = $118.8M in expected future value. $118.8M - $60.0M in guaranteed contract commitments = $58.8M in surplus value.3 points
-
3 pointsI’m not sure what I’m missing here, but a player’s surplus value when it comes to trades is based on expected future performance and not on historical performance. There isn’t a magical formula to calculate future performance, which means projections are inherently subjective even if the models used are data driven. The flawed input in this case is the forecast model that thinks a 25 year old, former 70 grade prospect in Yoan Moncada is not going to provide $60M in value over the next four years after coming off what would have been a 4 fWAR season despite being negatively impacted by COVID-19. If their model is ignoring player context, then the tool is basically worthless.3 points
-
2 points
-
2 pointsSince beginning of 2019, Musgrove and Lopez have both pitched 210 innings. Lopez allowed 80 walks and 44 home runs, musgrove 55 walks and 26 home runs. That’s a mighty wide divide Lopez would have to cross to get into Musgrove territory. If you’re looking at career war you’re ignoring Musgrove upward trend and Lopez’s downward spiral.2 points
-
2 pointsThanks Cali...cooking some risotto for the family and enjoying a fabulous St. Bernabus Apt 12 this Xmas Eve...all the best to you and all on Soxtalk for a wonderful Christmas and a healthy and happy New Year!! CHEERS everyone!!!2 points
-
@KrankinSox is this Bernie guy legit? He isn't named after a food or an appendage, so I'm skeptical.2 points
-
2 points2021 cannot come soon enough. Merry Christmas everyone. It is always great to hear from other Sox fanatics!!2 points
-
2 pointsThis is where you rely on fWAR over bWAR for pitcher evaluation. fWAR uses FIP as their basis for pitcher's WAR while BR uses runs allowed. The former provides a better indicator than the latter. Musgrove since becomes a full time starter 3 years ago: 2018 2.2 WAR / 19 GS 2019 3.3 WAR / 31 GS 2020 1 WAR/ 8 GS If you go with Statcast metrics, his xERA also suggests a pretty good pitcher. All in all, I think He's a a decent #3 starter who will give you 3-3.5 WAR in a full season, will cost somewhere around $8M over the next two years. I am not a Madrigal hater though, so I wouldn't give up Madrigal for him. Any combination of Stiever, Adolfo, Collins, Rutherford would be fine by me.2 points
-
2 points
-
2 pointsMadrigal or any top young player for Musgrove is a joke. Not to mention you close one hole and open another. The Lynn package would have been reasonable.2 points
-
2 points
-
2 points
-
2 pointsMerry Christmas everyone!! Enjoy it because this has been a hell of a year.2 points
-
2 pointsMlbpa needs a more wholistic approach but MLb deserves blame too. They put these rules in place just as it was clear ohtani was about to come over. Thankfully he still did, but it made it a difficult choice. The mlb commish should try to affirm to owners that actually it’s good for them to have the best players in the world come over and not freeze them out for years. Yeah, the draft will solve this, but this cba was garbage and the owners are way more interested in winning tit for tats with players than improving the game.2 points
-
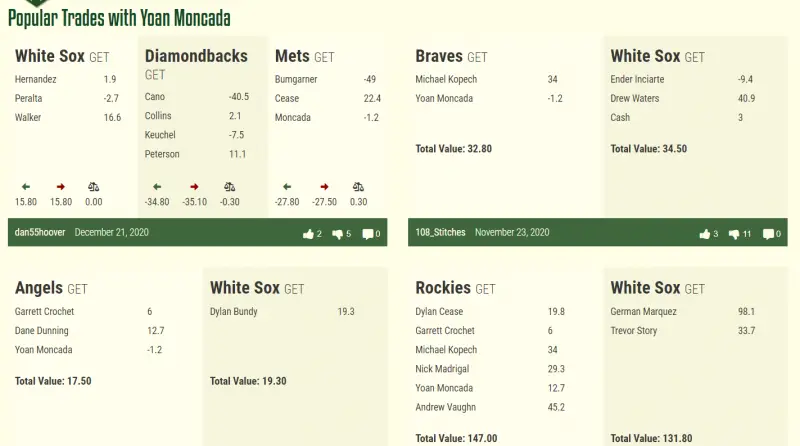
2 pointsLet's take Jack Flaherty vs. Yoan Moncada as an example, since both players had an incredible 2019 but a down year in 2020. Flaherty 2019 4.7 fWAR 5.7 bWAR 2020 0.6 fWAR -0.3 bWAR 2021 Steamer 2.9 fWAR Moncada 2019 5.7 fWAR 4.8 bWAR 2020 1.6 fWAR 0.7 bWAR 2021 Steamer 3.3 fWAR Now I am not sure which WAR model BTV uses, you referenced the lower of Moncada's 2020 WAR, but BTV links to the players profile on Fangraphs. One would then assume their model is more aligned to FG, which Moncada is considerably more valuable in 2019 and 2020. Using the logic that they are recency biased, it would be make sense if Flaherty projects to be a less valuable going forward than Moncada, especially since Flaherty has only 3 years of control left, and Moncada has 4 not counting the 2025 team option (and BTV incorrectly listed only 3 years of control left, yet they seem to have counted his salaries for the next 4 years, leading to a negative SV). Now they are projecting Flaherty to produce 103.2 AFV over the next 3 years while only 83.8 for Yoan (the difference here is SV fo a Dylan Cease), so this isn't just a dumb tool is fed with numbers from recent performance and spits out a projected value going forward. The problem here lies they have their own projection model, and it is different than the industry projection models, they also have some data issue where they only projected 3 years of control left for Moncada and counted his salaries for next 4. I would say the tool is a good baseline to check the ballpark estimate of SV for a player or trade, but it does leave room of subjectivity, Moncada is perfect example of an outlier. And for shits and giggles, if we do not apply subjectivity to the BTV values, we end up with shit like these:
 2 points
 -
2 pointsNope, I can’t get behind that at all. The 2019 season is equally important to his go-forward expectations as his 2020 season is. And using career stats ignores the natural aging curve and the fact he switched positions where he has been fantastic defensively. I’m starting to think you have an equity stake in the website.2 points
-
2 pointsFlash - Yoan Moncada was ranked as the 7th most valuable asset in baseball by Fangraphs in August. While not the end all be all, the reality is Yoan was one of the most valuable assets in baseball prior to 2020 and did not suddenly become a negative value player after a semi-disappointing, COVID impacted season. I tried using him as an example of a flawed projection methodology by BTV and this was your response: I then asked you if you were actually defending a negative surplus value projection for Yoan since you seemed to imply that I was somehow being emotional and/or non objective in calling out BVT. And yes, saying that Moncada has negative surplus value is a laughably bad take and I fully stand by that. Not sure you were even arguing that point or not, but it felt important to call out given your responses to what I deem to be very fair criticism.2 points
-
2 pointsWell done. The delta relates to your assumption of 3.3 wins per season vs. BTV's unpublished forecast based upon his actual performance last season (i.e. @700 OPS, 94 OPS+). There are other adjustments that they make which are not proprietary and described on the site. The model is impersonal and not specific to Moncada or any individual player. I do not take this stuff personally but rather as a distraction from the things that are personal. That said, your authoritative remarks such as 'this is the dumbest thing I've ever seen on this site' suggest you take yourself rather seriously. In any event, you can use Moncada as a proxy for how flawed BTV's model is and maybe you're right. In my observation, they usually get it right but thats not the point. Regardless of how you calculate Moncada's SV, its not going to be supportive of a Madrigal/Cease package for Castillo and Moustakas which was the basis of my original post.2 points
-
2 pointsTrue, but that's a long time away for people who need it yesterday.2 points
-
2 pointsDude, you are taking this way too personally, which is very strange since unless you created the site none of these comments are directed at you. You keep saying they provide a very “comprehensive” description of how they come up with their projections, but here is their blurb on this piece of it for major leaguers: Well gosh damn, it’s now clear as mud how they came up with that negative valuation for Yoan Moncada...lol. Again, you keep acting like coming up with a projected surplus value is simple math exercise and the reality is it’s not because future performance is uncertain. The prior season does NOT automatically predict the future season. I have no idea what BTV is doing to come up with a negative valuation (since they don’t explain their methodology!), but my guess is they are simply anchoring off the prior year. Meanwhile, well known projections systems like Zips & Steamer both project 3.3 win seasons for Yoan next year since they are looking at a broader set of data points and not just 2020 results. With no further growth in performance or with any inflation in the cost per win in free agency (so $9M per win in all years), his surplus value would be ~$60M. I personally would estimate his future production to be higher than what those models project (in this case more like a 4 win player), which would place his surplus value closer to $90M. Regardless, the point here is that some of BTV’s surplus value projections (more than just Yoan) are simply bad, which undermines the tool. By all means keep using it as a reference point, but if you posted any outputs that involved Moncada for example you would be laughed at. This has nothing to do with White Sox fans overvaluing Yoan, but everything to do with BTV’s poor forecast model undervaluing him due to a bad 2020 season.2 points
-
2 pointsTeaching is my second career. I was in electronic part sales for 20 years while living in Chicago. Did you know Chicago was the epicenter of video games? Pac Man, Asteroids, Frogger were all build in the area. Then after AT&T was dissolved, telephony was huge. GE, Tellcom, and others manufactured all sorts of telephone backbone stuff. US Robotics and Incomm Data sold a crap load of modems in the early days of the internet. I love learning things and trying stuff. Boredom is my kryptonite. The only consistent long term things have been reading and golf.2 points
-
2 pointsNot talking necessarily about power. After not even 60 games (he was injured a decent amount of that time, too), based on what I have seen here we have apparently surmised: 1. He will never have more power. 2. He will never have more pop in his bat. 3. He will always be a bad baserunner. 4. He will always think he is faster than he is. 5. More outfielders will play shallow every time now and thus, he will never get a base hit ever again. 6. He's short, so screw him. 7. Surely none of these things can ever change (being short is one he definitely can't but in all seriousness...), because God knows these things also always applied to his minor league career and his minor league career traits surely cannot ever apply to him growing as a major leage player. He will never improve. Probably because he's short. Damn midget. Does that cover all the bad takes? Everyone was writing off Moncada after less than 1 season here and look how that turned out. It's tiresome. No one has any damn patience. Need I remind people he hit .340 in his rookie season. And if you're gonna use "small sample size" as an excuse to discredit him then maybe you should... take your own advice with the criticisms of said sample size?2 points
-
Good teams burn money on players like La Stella. The Sox instead use min salary players like Mendick.2 points
-
1 pointPittsburgh is obviously blowing things up. Musgrove could be a good fit for the Sox. Thoughts?1 point
-
1 pointGo to www.baseballtradevalues.com and scroll to About/Valuing Major League Players. Its a fun site to crawl around and in my observation, their methodolgy doesn't leave much room for subjectivity. Its also a good source for 'native' perspective on potential trade scenarios. is there room for disagreement? Sure. But, if you go back and review actual trades that have occurred, you'll find BTVs relatve values were very much in the bandwidth if not spot on.1 point
-
I’d have to think a “splash” would be Springer since we’re talking about the Mets.1 point
-
1 pointGmab. Musgrove is a year older, has pitched 496 innings to Lopez’s 490, 4.3 rWAR for musgrove versus 3.2 for Lopez. Potential stud? I mean anyone could be but come on, that’s another Reynaldo Lopez you’re just imagining will work out with your pitching coach when the Astros and Pirates couldn’t do it.1 point
-
Let’s hope it’s actually a competitive offer and not like the “offer” they made for Machado.1 point
-
1 pointAlthough it's been said many times, many ways, Merry Christmas to you.1 point
-
Bernie was also CONVINCED that the Whitesox would spend on big free agents earlier in the offseason and defended Reinsdorf until they signed Eaton. So take this opinion with a grain of salt.1 point
-
1 pointMerry Christmas one and all, and hope us fans get a few more players in our stockings before opening day, hopefully sometime this Spring!1 point
-
1 point
-
1 point
-
1 point1 point1 point1 point1 pointIt’s hard when the mlb has now seen 25 years of interference free play to point the finger at it, but it just seems so much more dysfunctional for both parties than the other leagues.1 point1 pointFor the last time...its a model. It doesn't care about the persona, only the data. You want to make this about your perceived criteria on how Moncada should be valued. Fine but thats not how their model works. If you want to assign and pay for the value Yoan receives for his FG ranking go ahead. Its just not how they view things and it doesn't matter what either you or I think. I sent you to the site and youv'e crapped all over it 4 times because you disagree with how they calculate Moncada's SV. Just don't go to the site or use their data...I really don't care.1 point1 pointIn the 5 years Yoan has been in MLB he is avergaged 1.6 WAR/yr. This was inflated due to his strong 2019 of 4 plus. Given recency bias of 0.7 WAR in 2020 as most models will have, and the fact that its an algorithm that doesn't conflate how publications rank him or whether or not he had Covid in the context of a $60M contract, one can understand how he has negative SV according to BTV. Again, let's not confuse SV with market value.1 point1 pointLast time....the BTV model doesn't know a guy named Yoan Moncada. It doesn't care what his prospect grade was or that he was coming off Covid. Its a dumb tool. What it does care about is some player coming off of a year with an OPS+ of 94 and WAR of 0.7 and, based upon assumptions relating to future performance and an implied WAR value of $9M, how much, if any, suplus value exists over the life of his contract. The model doesn't make trades...its a tool to help us fake GMs assess trade fairness. Its up to the users of the tool to add 'player context'. Its not the end all be all but I reference it here from time to time when random trade proposals are offered without regard for relative value. If you are someone who needs an algorithm to quantify and forecast the subjective qualities of a player, of course you will consider the tool 'basically worthless'.1 point1 pointI didn't bring up Yoan...you did. I'm not arguing anything. You commented that "it’s only as good as the inputs and clearly there are some cracks in that department" and I was trying to help you understand that the inputs you are referring to represent actual performance data. Their 'tool' doesn't care who the player is, only actual performance in the context of contract value. I clearly stated "Thats not to say his SV is the equivalent of his market value because we all know how talented he is..." I don't know how I can make this any clearer to you without sounding argumentative or making snarky remarks such as 'that's one of the most ridiculous takes I have ever seen on this sight'.1 pointThis leaderboard is set to Chicago/GMT-05:00




.thumb.jpg.a56807a7fe5c83b6a9f37963092612ef.jpg)


.thumb.jpeg.80bf23436bcc9fc1d4b954272d2e0de5.jpeg)